A VFR Sectional Aeronautical Chart is a pictorial representation of a portion of the Earth’s surface upon which lines and symbols in a variety of colors represent features and/or details that can be seen on the Earth’s surface. Contour lines, shaded relief, color tints, obstruction symbols, and maximum elevation figures are all used to show topographical information. Explanations and examples may be found in the chart legend. Pilots should become familiar with all of the information provided in each Sectional Chart Legend. Today we’ll look at the FAA’s Aeronautical Chart User’s Guide introduction to land features (terrain) and obstructions. This publication is available from ASA in a print and eBook formats, and a pictorial guide to topographical features can be found on pages 28 to 36.
We use five different techniques to clearly show the shape of the earth and any obstructions: contour lines, shaded relief, color tints, obstruction symbols, and Maximum Elevation Figures (MEF).
-
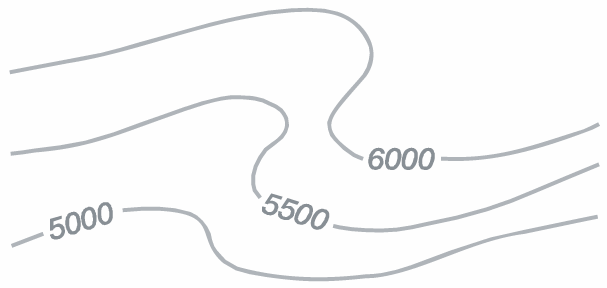
- Contour lines join points of equal elevation. On Sectionals, basic contours are spaced at 500′ intervals. Intermediate contours are typically at 250′ intervals in moderately level or gently rolling areas. Auxiliary contours at 50′, 100′, 125′, or 150′ intervals occasionally show smaller relief features in areas of relatively low relief. The pattern of these lines and their spacing gives the pilot a visual concept of the terrain. Widely spaced contours represent gentle slopes, while closely spaced contours represent steep slopes.
-
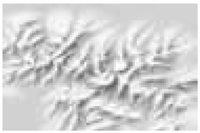
- Shaded relief shows how terrain may appear from the air. Shadows are shown as if light is coming from the northwest, because studies show that our visual perception has been conditioned to this view.
-
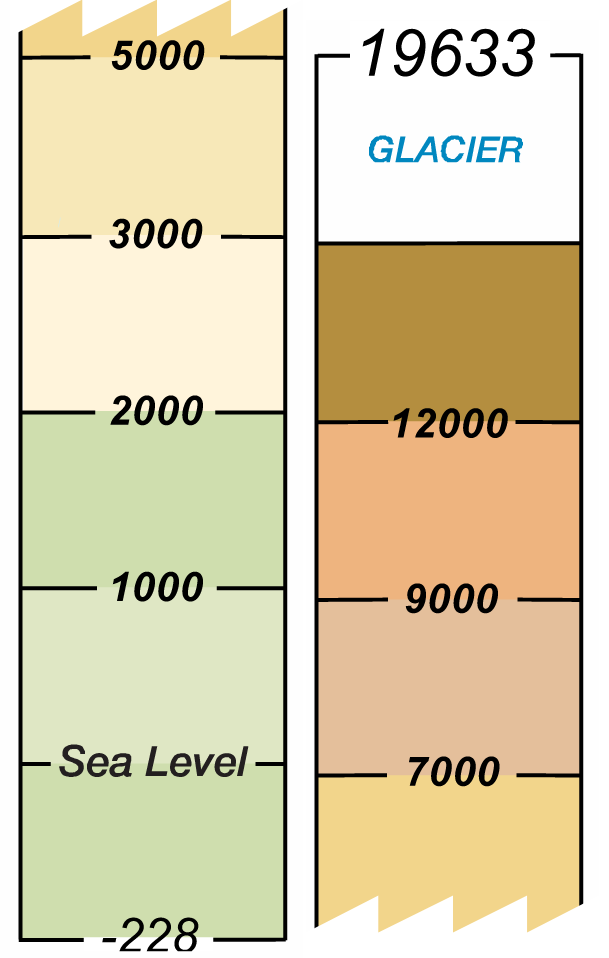
- Different color tints show bands of elevation relative to sea level. These colors range from light green for the lower elevations, to dark brown for the higher elevations.
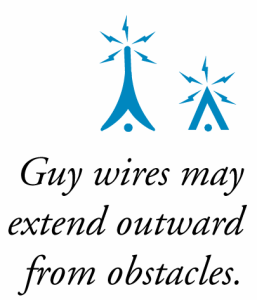
- Obstruction symbols show man made vertical features that could affect safe navigation. FAA’s Aeronautical Information Management maintains a database of over 1,200,000 obstacles in the U.S., Canada, Caribbean, Mexico, and U.S. Pacific Island Territories. Aeronautical Specialists evaluate each obstacle based on charting specifications before adding it to a visual chart. When a Specialist is not able to verify the position or elevation of an obstacle, it is marked UC, meaning it is “under construction” or being reported, but has not been verified.Sectional Charts and Terminal Area Charts (TACs) typically show manmade obstacles extending more than 200’ Above Ground Level (AGL), unless they appear in yellow city tint. Features considered to be hazardous obstacles to low-level flight are; smokestacks, tanks, factories, lookout towers, and antennas, etc. On World Aeronautical Charts (WACs) only those obstacles at 500’ AGL and higher are charted.

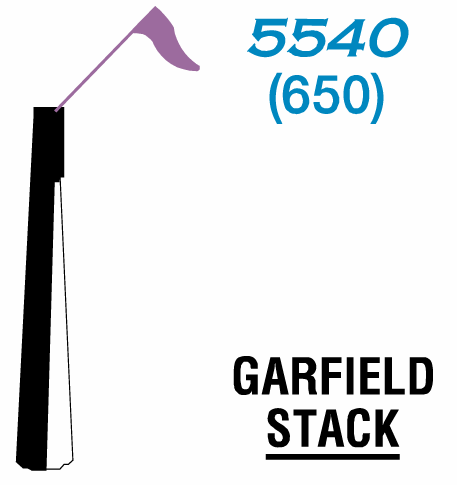
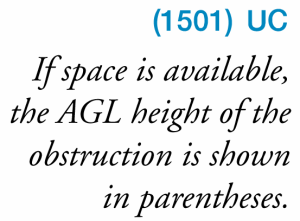
Manmade features used by FAA Air Traffic Control as checkpoints use a graphic symbol shown in black with the required elevation data in blue. The elevation of the top of the obstacle above Mean Sea Level (MSL) and the height of the structure (AGL) is also indicated (when known or can be reliably determined by a Specialist). The AGL height is in parentheses below the MSL elevation. In extremely congested areas, the FAA typically omits the AGL values to avoid confusion.
Whenever possible, the FAA depicts specific obstacles on charts. However, in
high-density areas like city complexes, only the highest obstacle is represented on
the chart using the group obstacle symbol to maximize legibility.

Obstacles under construction are indicated by placing the letters UC next to the obstacle type.
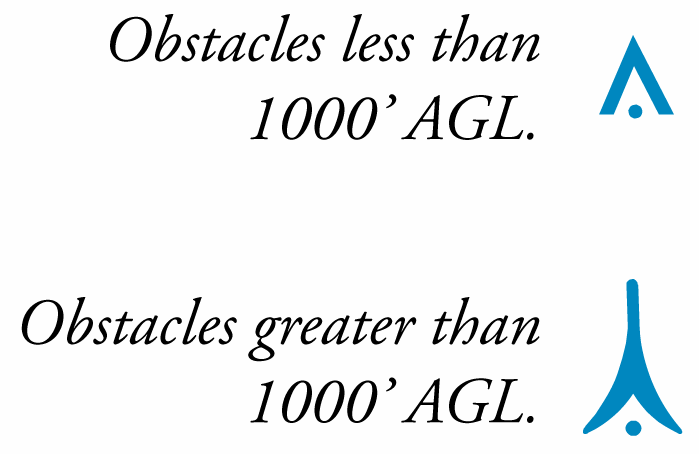
Obstacles with high-intensity strobe lighting systems may operate part-time or by proximity activation and are shown as follows:
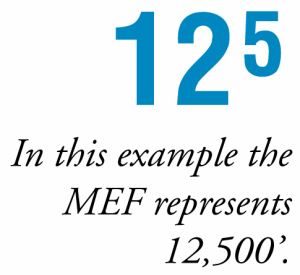
- The Maximum Elevation Figure (MEF) represents the highest elevation within a quadrant, including terrain and other vertical obstacles (towers, trees, etc.). A quadrant on Sectionals is the area bounded by ticked lines dividing each 30 minutes of latitude and each 30 minutes of longitude. MEF figures are rounded up to the nearest 100’ value and the last two digits of the number are not shown.
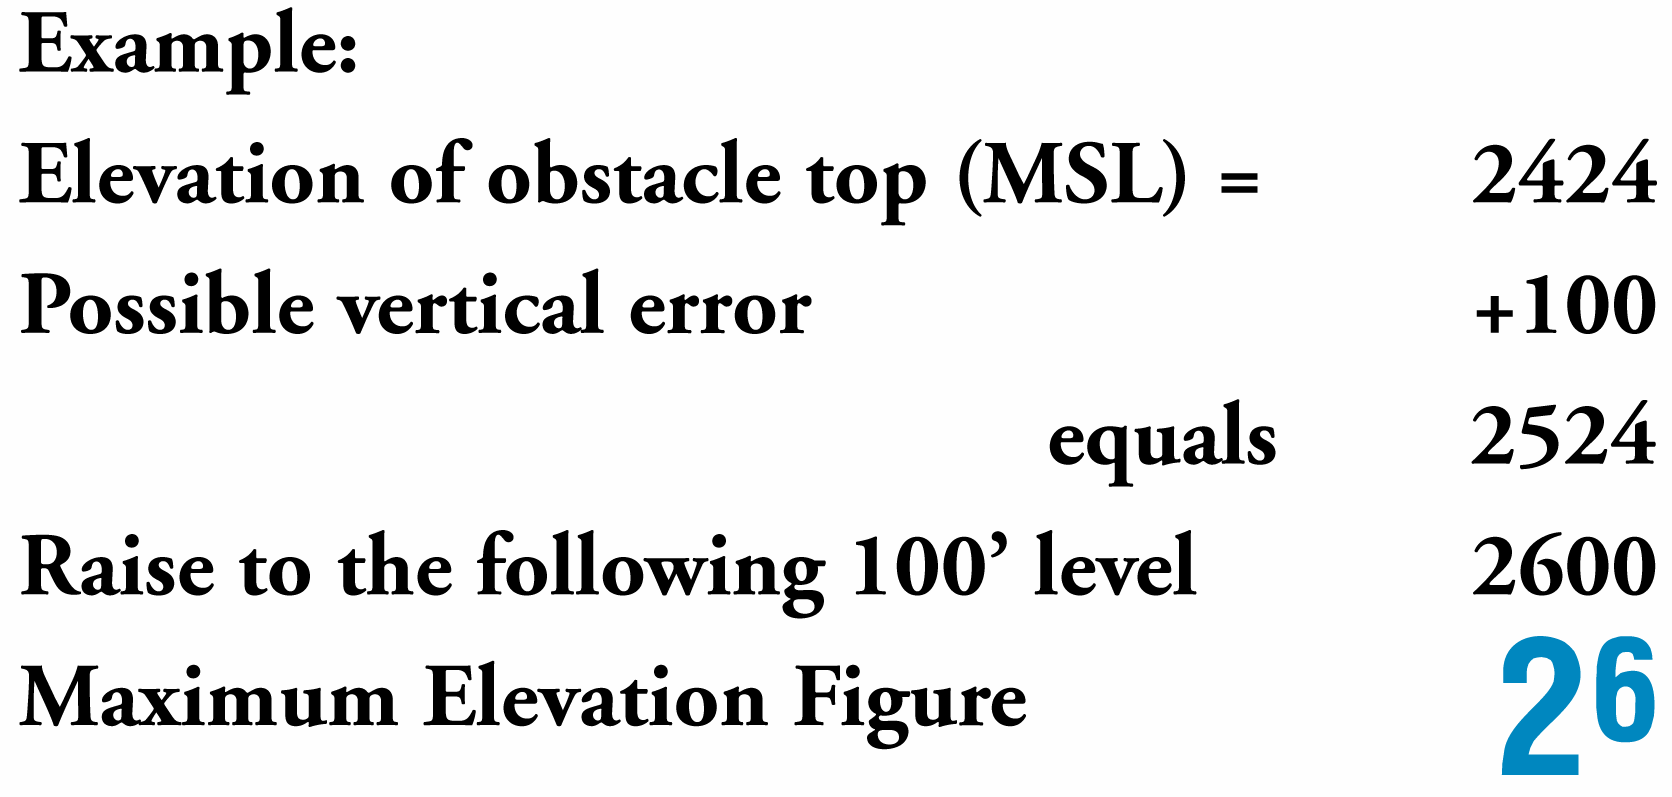
When a manmade obstacle is more than 200’ above the highest terrain within the quadrant:-
- Determine the elevation of the top of the obstacle above MSL.
- Add the possible vertical error of the source material to the above figure (100′ or 1/2 contour interval when interval on source exceeds 200′.)
- Round the resultant figure up to the next higher hundred-foot level.

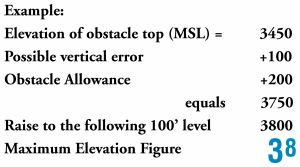
When a natural terrain feature or natural vertical obstacle (e.g. a tree) is the highest feature within the quadrangle:
-
- Determine the elevation of the feature.
- Add the possible vertical error of the source to the above figure (100′ or 1/2 the contour interval when interval on source exceeds 200′).
- Add a 200′ allowance for uncharted or manmade obstacles. Chart specifications don’t require the portrayal of obstacles below minimum height.
- Round the figure up to the next higher hundred-foot level.
We’ll be back with more on Thursday!
-