Using the knowledge you learned from Monday’s post on the Vg diagram, let’s see if we can answer some of these sample FAA knowledge test questions. Remember, a complete database of sample questions can be found in ASA Test Prep Books and Prepware Software!
Reference the figure below for all questions, however please note on the horizontal scale airspeed’s should be listed as knots, mph is a misprint.
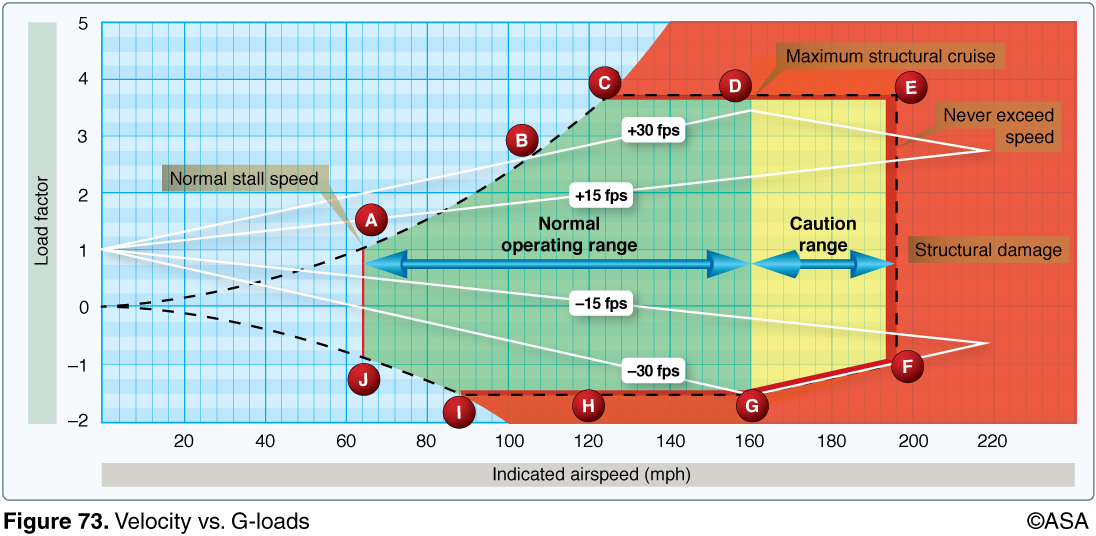
1. A positive load factor of 4 at 140 knots would cause the airplane to
A—stall.
B—break apart.
C—be subjected to structural damage.
2. The airspeed indicated by point C is
A—maneuvering speed.
B—never-exceed speed.
C—maximum structural cruising speed.
3. The horizontal dashed line from point C to point E represents the
A—ultimate load factor.
B—positive limit load factor.
C—airspeed range for normal operations.
4. The vertical line from point E to point F is represented on the airspeed indicator by the
A—upper limit of the yellow arc.
B—upper limit of the green arc.
C—blue radial line.
5. The positive limit load factor is represented by the
A—vertical dashed line from E to F.
B—vertical solid line from D to G.
C—horizontal dashed line from C to point E.
BONUS!
What load factor would be created if positive 30 feet per second gusts were encountered at 130 knots?
A—3.8.
B—3.0.
C—2.0.
ANSWERS BELOW
⇓
⇓
⇓
⇓
⇓
⇓
⇓
⇓
1. A positive load factor of 4 at 140 knots would cause the airplane to
C—be subjected to structural damage.
The horizontal line for a load factor of 4 crosses the vertical line for 140 knots in the shaded area, indicating possible structural damage.
2. The airspeed indicated by point C is
A—maneuvering speed.
The airspeed indicated by point C is V(A), the design maneuvering airspeed. This is the maximum airspeed recommended for flight into turbulence.
Answer (B) is incorrect because V(NE) is indicated by point E. Answer (C) is incorrect because V(NO) is indicated by point D.
3. The horizontal dashed line from point C to point E represents the
B—positive limit load factor.
C to E is the maximum positive load limit. In this case it is 3.8 Gs, which is appropriate for normal category airplanes.
4. The vertical line from point E to point F is represented on the airspeed indicator by the
A—upper limit of the yellow arc.
V(NE) (never exceed airspeed), the vertical line from point E to F, is marked on airspeed indicators with a red radial line, the upper limit of the yellow arc.
5. The positive limit load factor is represented by the
C—horizontal dashed line from C to point E.
C to E is the maximum positive load limit. In this case it is 3.8 Gs, which is appropriate for normal category airplanes.
Answer (A) is incorrect because the vertical dashed line from E to F is the never-exceed airspeed (Vne). Answer (B) is incorrect because the vertical solid line from D to G is the high end for normal operations.
BONUS: What load factor would be created if positive 30 feet per second gusts were encountered at 130 knots?
B—3.0.
Follow the slanted line for +30 fps gusts until it crosses an imaginary vertical line for 130 knots (midway between 120 and 140 knots). This intersection falls on the horizontal line for a load factor of 3.0.
Featured image by TarikVision at stock.adobe.com.