Weather information can be divided into two categories: observations, and forecasts. An observation is a snapshot of weather conditions at a stated time; its utility degrades over time. Some observations can be as much as an hour old when you first see them. If your planned trip is four to seven days in the future, you’ll use forecasts in your flight planning. This post, excerpted from Bob Gardner’s The Complete Private Pilot, will introduce several of the weather services you’ll encounter as a private pilot
METAR
These answer the question “What’s going on at my departure airport, my destination, and at enroute airports?” Every reporting weather station issues an hourly observation called an aviation routine weather report, or METAR, which includes cloud cover and visibility, wind direction and velocity, altimeter setting, and remarks. If you see SPECI instead of METAR, that means something important has changed since the hourly METAR was issued…and it is usually a change for the worse. The figure below contains the key to interpreting METARs. Note: This key will not be available to you for your FAA Knowledge Exam, so learn to read and understand the information without the key.
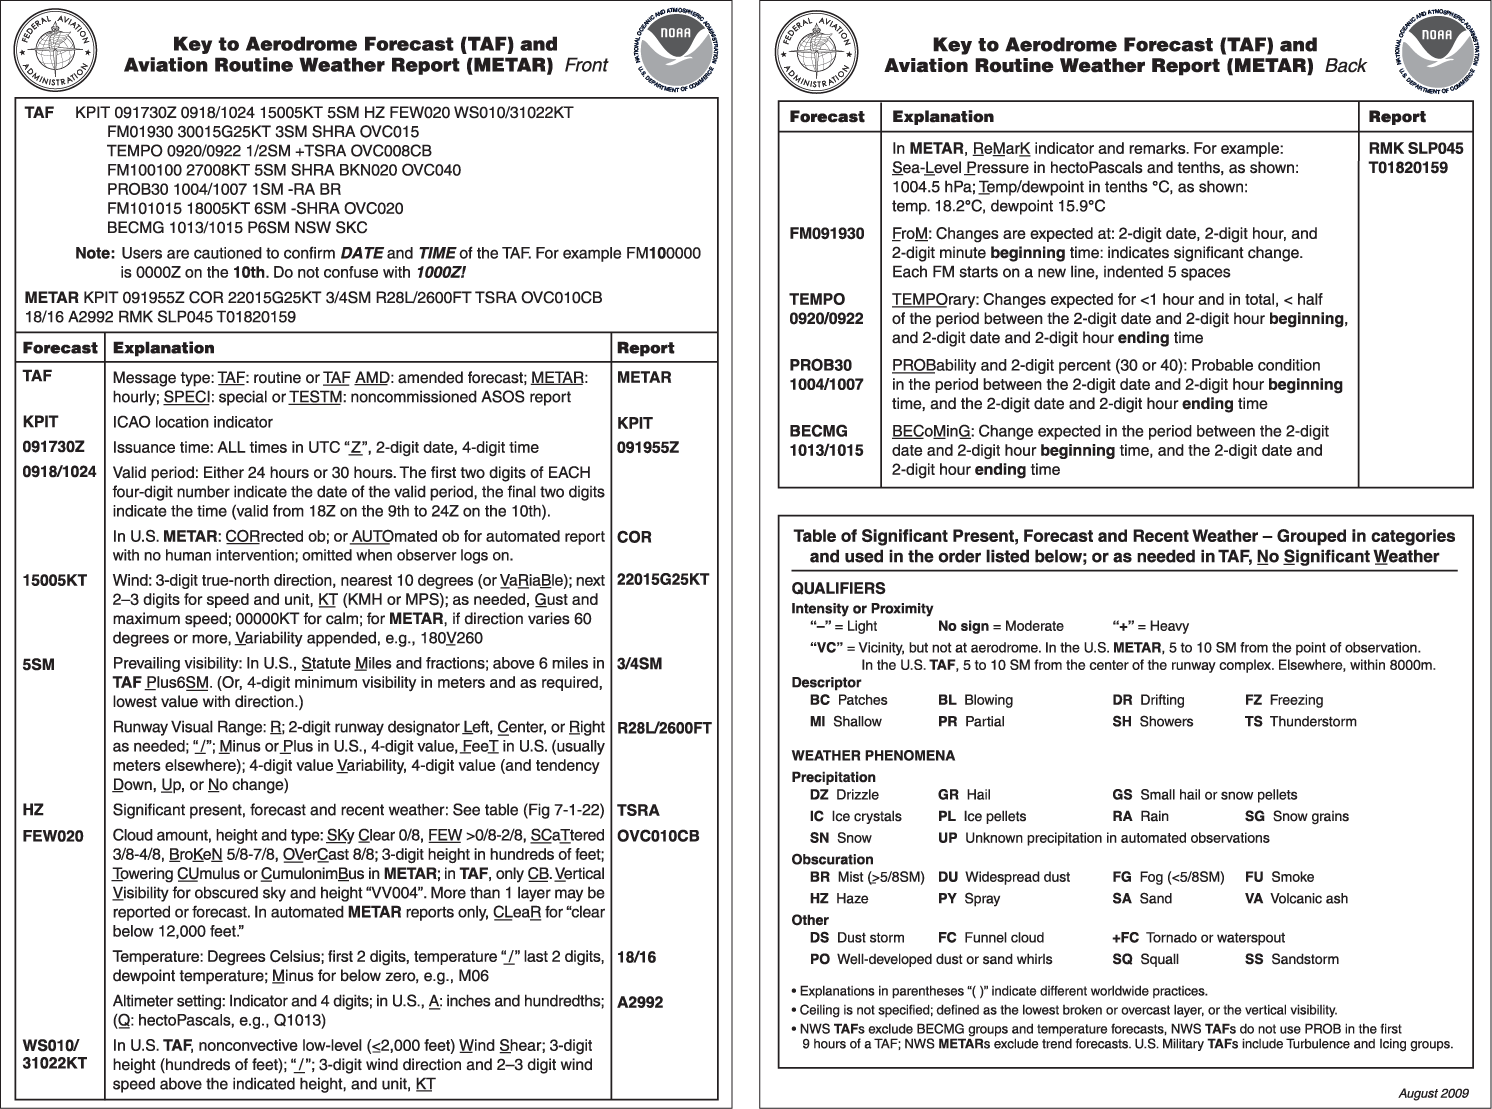
Learning to read METARs is a basic pilot skill. The general format is: Station identifier, date-time group, wind, visibility, weather (obstructions to visibility), sky condition, temperature and dewpoint, altimeter setting, and remarks.
Satellite Images
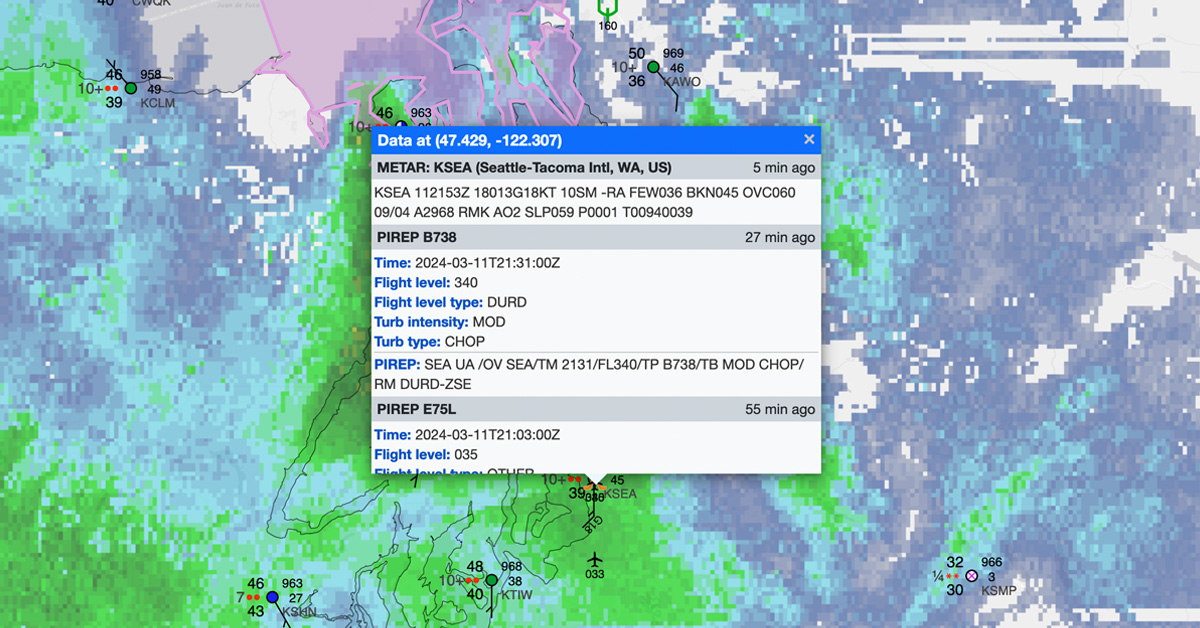
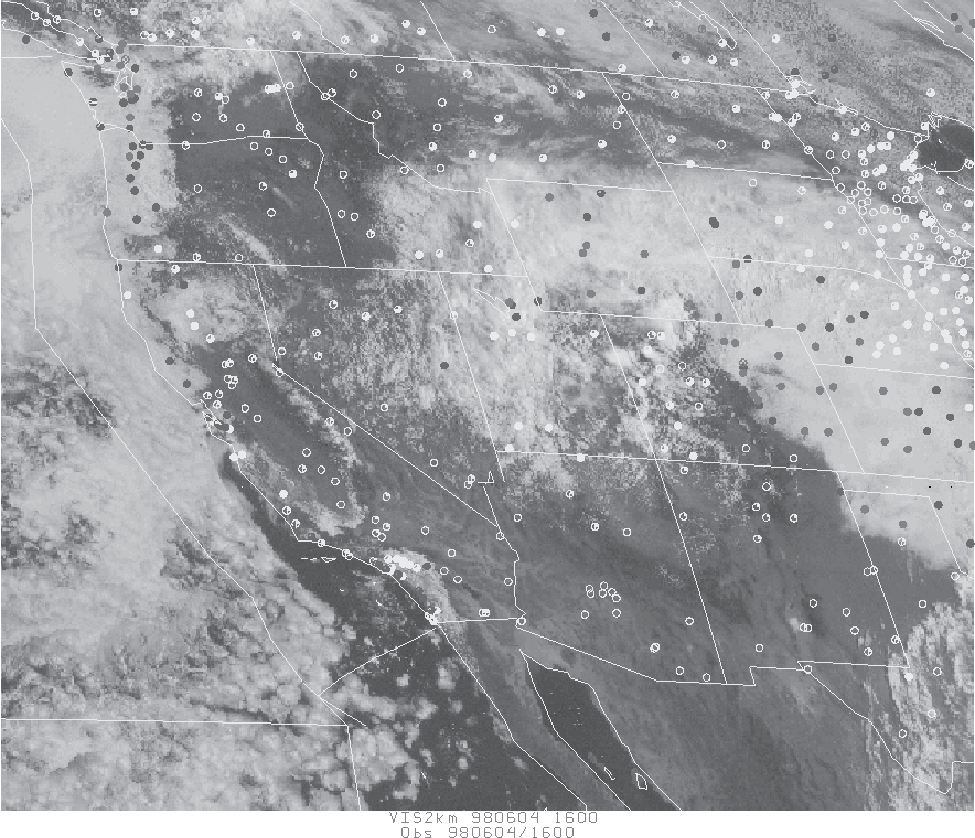
While you are still in the “can I get there from here…and back?” stage of planning, the ADDS webpage gives you another easy reference to reported weather. On the ADDS page, click the Satellite tab and select either the Western U.S. or Eastern U.S. with overlay of color-coded LIFR, IFR, MVFR, and VFR station models. You will be able to see the cloud cover at the time the image was taken and get an overview of the reported cloud cover at each station…you obviously want to stay away from any station symbol colored red or pink and look for more information when the color is blue (marginal VFR). See the figure below.
Pilot Reports
The best resource available to the weather briefers is an observation made by a pilot in flight—a pilot report, or PIREP. There is no better way for the National Weather Service to fill in the gaps between reporting stations than by PIREPs, and they solicit your cooperation.
Forecasters rely on pilot reports to verify the accuracy of their forecasts; they need to know where forecast conditions do not exist just as much as they need reports of the weather conditions you encounter. The only way for a forecaster, who called for a broken layer at 5,000 feet, to know that the forecast is not accurate, is for some conscientious pilot to call a flight service station and report that the layer doesn’t exist (or that it appears to be at 10,000 feet). That PIREP ends up at the Aviation Weather Center in Kansas City, which passes it on to other interested parties, including researchers.
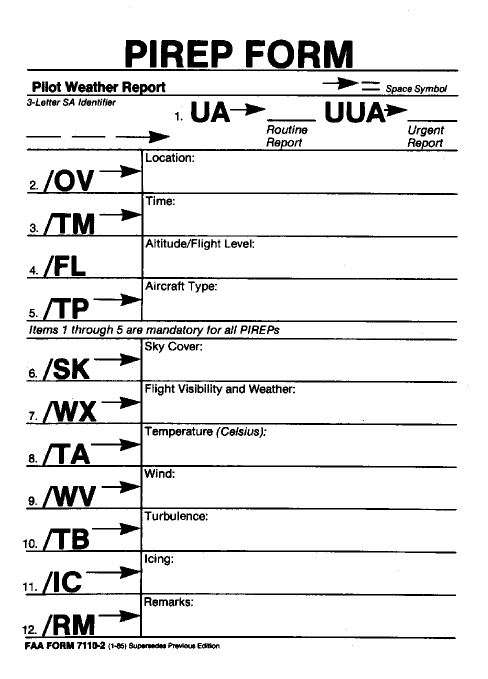
The figure above is a PIREP form, available in pads from your local FSS. You don’t need a form to make a report, however. Just call Flight Watch on 122.0 or contact a flight service station on its published frequency (you can’t go wrong by using 122.2). If you have the form available it will help you organize your report, but if not, the briefer knows what questions to ask.
Automated Weather Reporting Stations
Advances in sensor technology have made it possible for automated weather reporting stations to replace human observers in many locations. Some of these observations are incorporated in METARs, others are available by phone or radio, still others show up at the flight service station for use by the briefer. The Automated Weather Observing Station (AWOS), designed by the FAA, and the Automated Surface Observing Station (ASOS), designed by the NWS, are the most common. The NWS will have almost 2,000 ASOS installations in operation across the country when their program is complete. You’ll find a blue circle with a reversed “A” in the frequency box when an automatic sensor is used.
The ASOS has many advantages over the AWOS, but both measure cloud cover, visibility, barometric pressure, precipitation and wind. The difference lies in how these measurements are made and how the results are transmitted to the NWS. At those locations where a computerized voice transmits the readings over aviation radio frequencies, the necessary information will be on sectional charts.
Radar Summary Chart
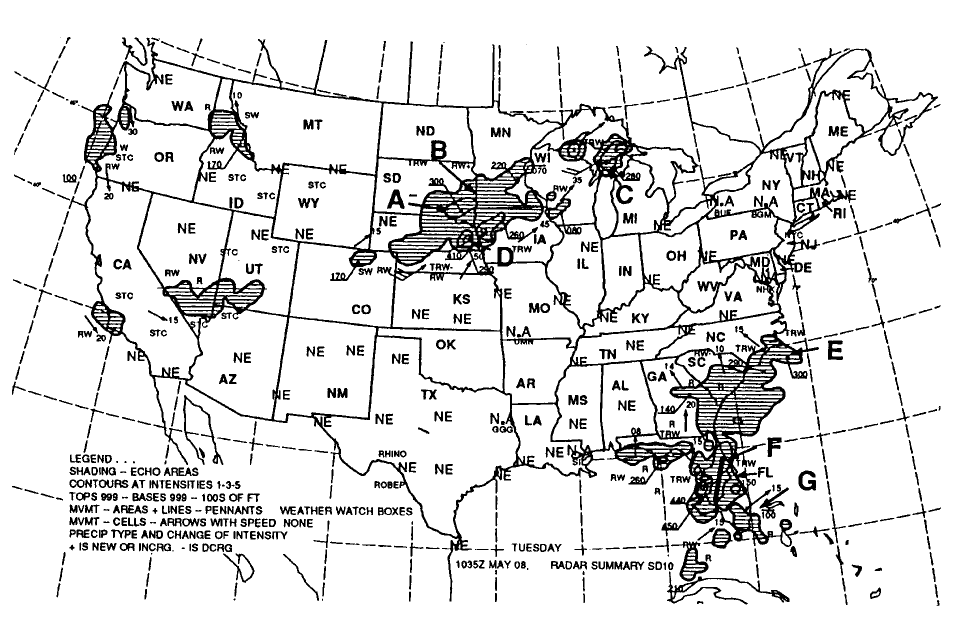
This chart is based on observations; it is not a forecast. Radar will show only precipitation, not clouds or fog. The radar summary chart shows the location of radar echoes from precipitation, and the direction and speed of movement of lines of cells and individual cells. This is the only weather chart that shows this information.
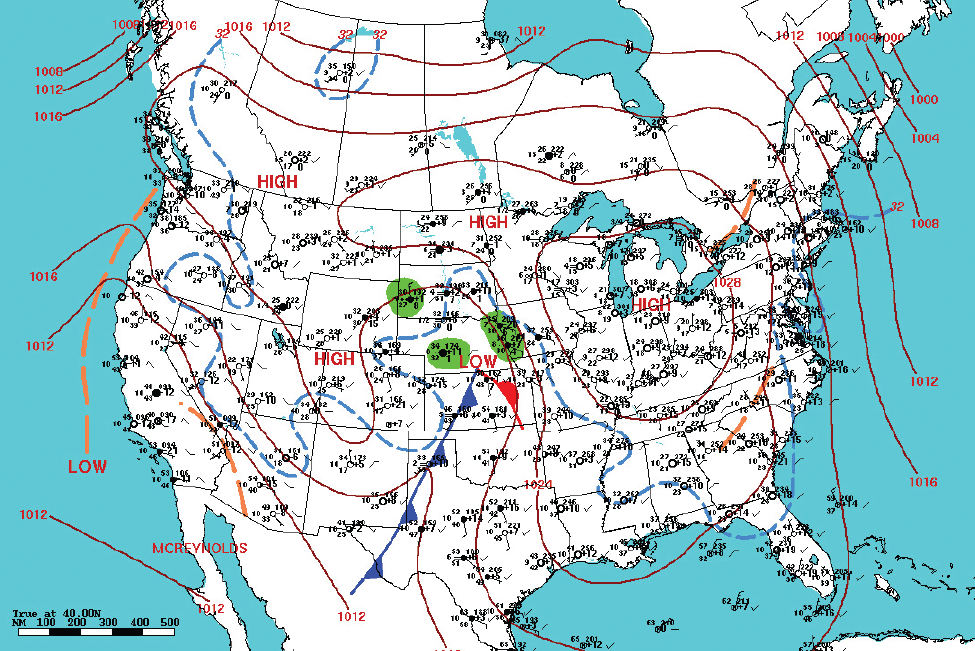
Surface Analysis Chart
The NWS issues surface analysis charts eight times daily (every three hours). These charts reflect the observations of sky cover, visibility, surface wind direction and velocity, temperature, dewpoint, weather (obstructions to visibility), sea level pressure, and pressure trend.
SIGMETs and AIRMETs
A SIGMET (Significant Meteorological Information) contains warnings applicable to all aircraft, even airliners, and deserve your close attention. A SIGMET warning area covers at least 3,000 square miles; however, the weather event forecast might occur in only a small portion of this total area.
A SIGMET is issued when one of the following occurs or is forecast to occur:
• Severe icing not associated with thunderstorms.
• Severe or extreme turbulence not associated with thunderstorms.
• Dust storms or sandstorms lowering visibilities to below 3 miles.
• Volcanic ash.
An AIRMET (Airmen’s Meteorological Information) contains information about IFR, strong surface winds, mountain obscuration, turbulence, icing, and freezing levels. An airline pilot will take note of an AIRMET but will probably not cancel because of the forecast conditions. “Little airplane” pilots will take heed.
Aviation Area Forecast (FA)
The Area Forecast is your only direct source of information on expected turbulence, icing, and heights of cloud tops. It contains a synopsis of the weather to help you evaluate the potential for change. Watch for words like “unstable,” “low pressure,” and “front.” It also includes forecasts of potentially hazardous weather as “flight precautions.” Area forecasts are issued three times daily and are amended as required. The “Significant Clouds and Weather” portion is valid for 12 hours and contains an additional 6-hour outlook.
Winds Aloft Forecast (FB)
These forecasts (see the figure below) are issued twice daily and include a “valid time.” Heights are above sea level, and no forecast is available within 1,500 feet of the reporting station’s elevation. Wind direction and velocity are read just as they are in an hourly sequence, except that no gusts are forecast.
A major weakness of the FB is the 3,000-foot gap between altitudes and the lack of any relative humidity or dewpoint information. At best, it forces you to interpolate between values; at worst, it glosses over changes that might occur at intermediate altitudes. However, it is the forecast product used in knowledge exams and for that limited purpose you must live with it.
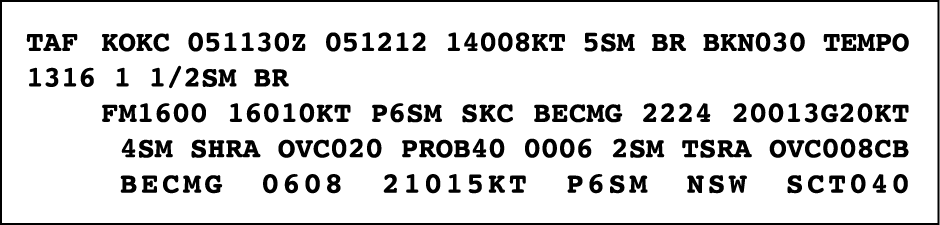
Terminal Aerodrome Forecast (TAF)
Terminal Aerodrome Forecasts, or TAFs, are prepared four times daily: 0000Z, 0600Z, 1200Z, and 1800Z, for selected reporting stations. TAFs predict conditions for a 5-mile area surrounding the airport. Note that limited area! Many pilots think that they cover more area. Each forecast (with the exception of special forecasts) is valid for 24 hours.