In the latest Airman Knowledge Testing Supplement for Instrument Rating (CT-8080-3F), the FAA has added several Graphical Forecast for Aviation (GFA) figures. These figures are 260 through 271 in the supplement and although the FAA has not yet added questions to the Instrument knowledge test on GFA, this weather tool is still something to become familiar with.
The GFA at the Aviation Weather Center (AWC) website is an interactive display providing continuously updated observed and forecast weather information over the continental United States (CONUS). It is intended to give users a complete picture of weather critical to aviation safety. The GFA display shows user-selected weather categories, each containing multiple fields of interest at altitudes from the surface up to FL480. Depending on the field of interest chosen, weather information is available from -6 in the past (observed) to +15 hours in the future (forecast).
The GFA is not considered a weather product but an aggregate of several existing weather products. The information and data from the various weather products are overlaid on a high-resolution basemap of the United States: www.aviationweather.gov/gfa. The user selects flight levels and current time period for either observed or forecast weather information. Mouse-clicking or hovering over the map provides additional information in textual format, such as current METAR or TAF for a selected airport. The GFA replaces the textual area forecast (FA) for the CONUS and Hawaii with a more modern digital solution for obtaining weather information. The Aviation Surface Forecast and Aviation Cloud Forecast graphics are snapshot images derived from a subset of the aviation weather forecasts.
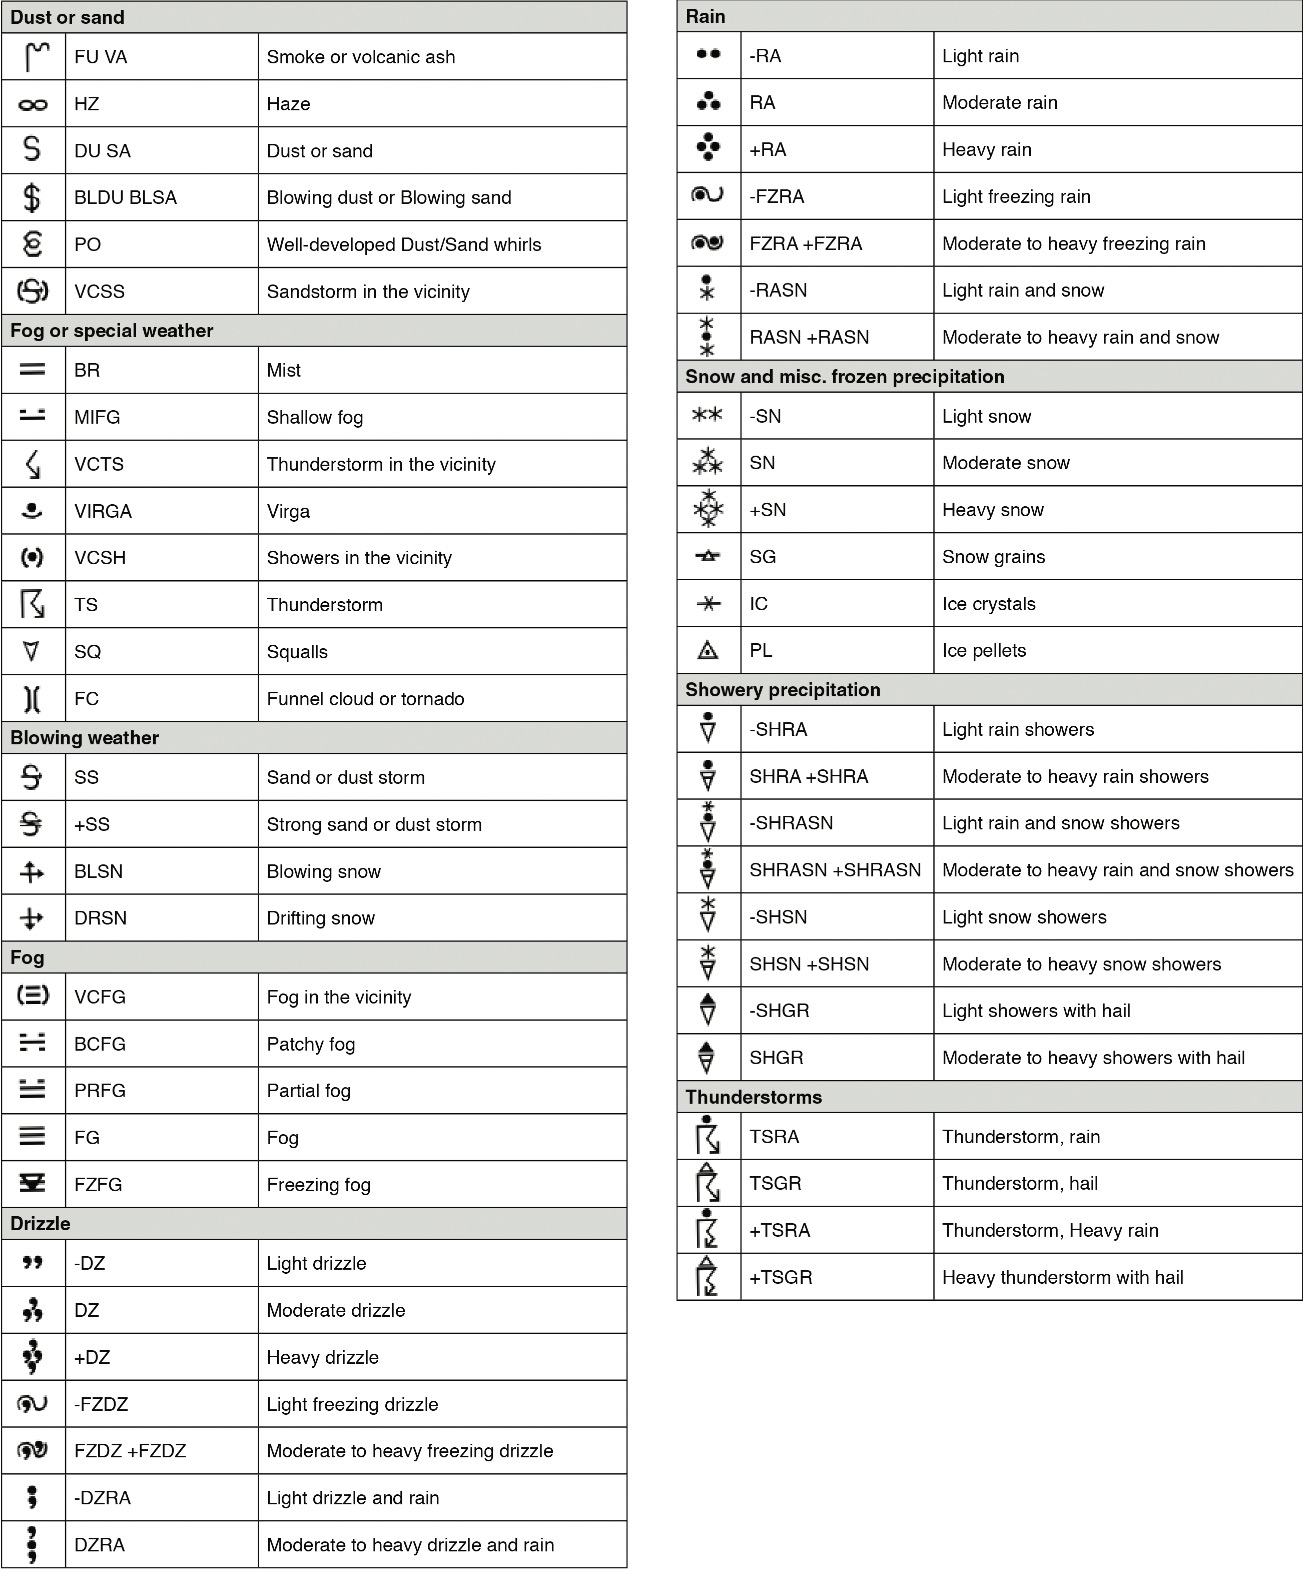
The Aviation Surface Forecast displays surface visibility with overlays of wind and gusts, predominant precipitation type (i.e., rain, snow, mix, ice, or thunderstorm) coincident with any cloud and predominant weather type (i.e., haze, fog, smoke, blowing dust/sand). The graphical AIRMETs (Airmen’s Meteorological Information) for instrument flight rules (IFR) and strong surface wind are overlaid. See FAA Figure 260. Forecast surface visibility is contoured for Low IFR (0 – 1 statute miles), IFR (1 – 3 statute miles), and Marginal VFR (MVFR; 3 – 5 statute miles) conditions. Visibilities in excess of 5 statute miles are not shown. Winds are depicted with a standard wind barb, in red when indicating gusts (see the figure below).
Below are some sample questions for what you could expect to see on an FAA knowledge test in the near future using those aforementioned GFA figures.
1. (Refer to Figure 261.) The precipitation type forecast to occur over southern ND (area C) is
A—Freezing rain.
B—Freezing drizzle.
C—Moderate snow.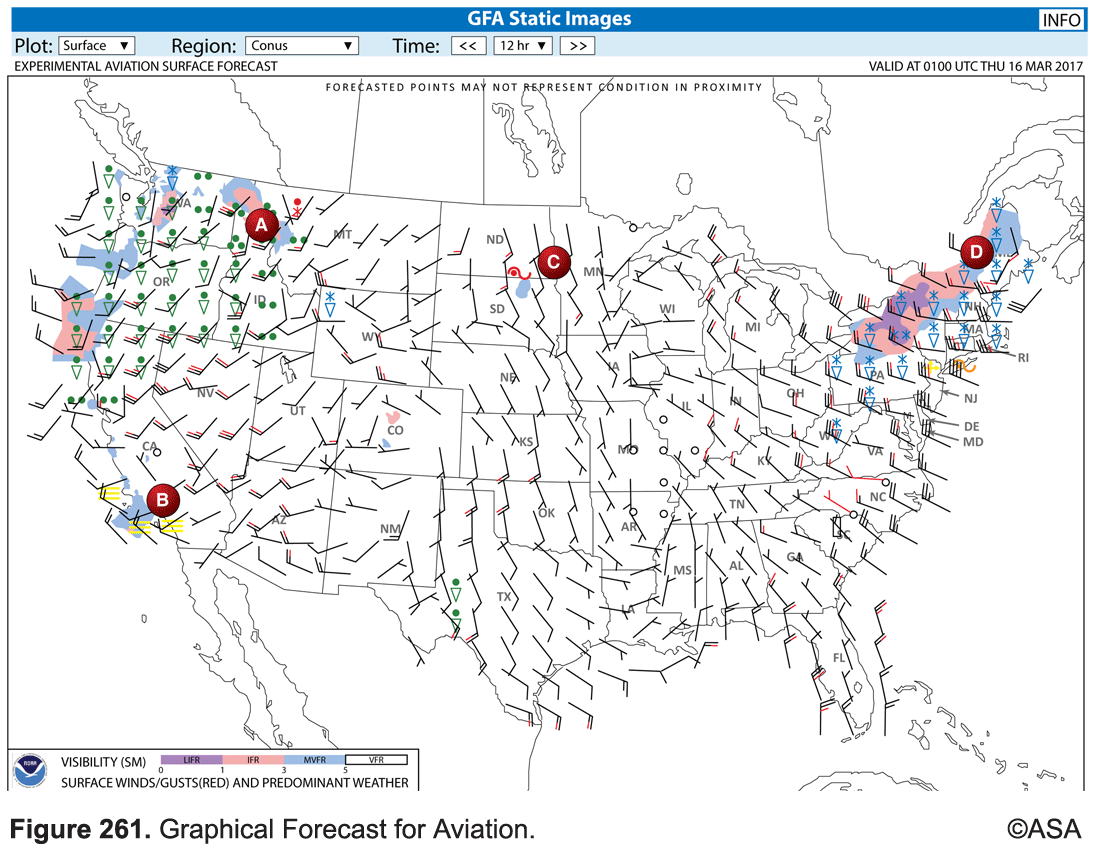
2. (Refer to Figure 266.) Precipitation throughout Washington and Oregon is predominantly
A—Light rain and rain showers.
B—Heavy rain showers.
C—Freezing rain.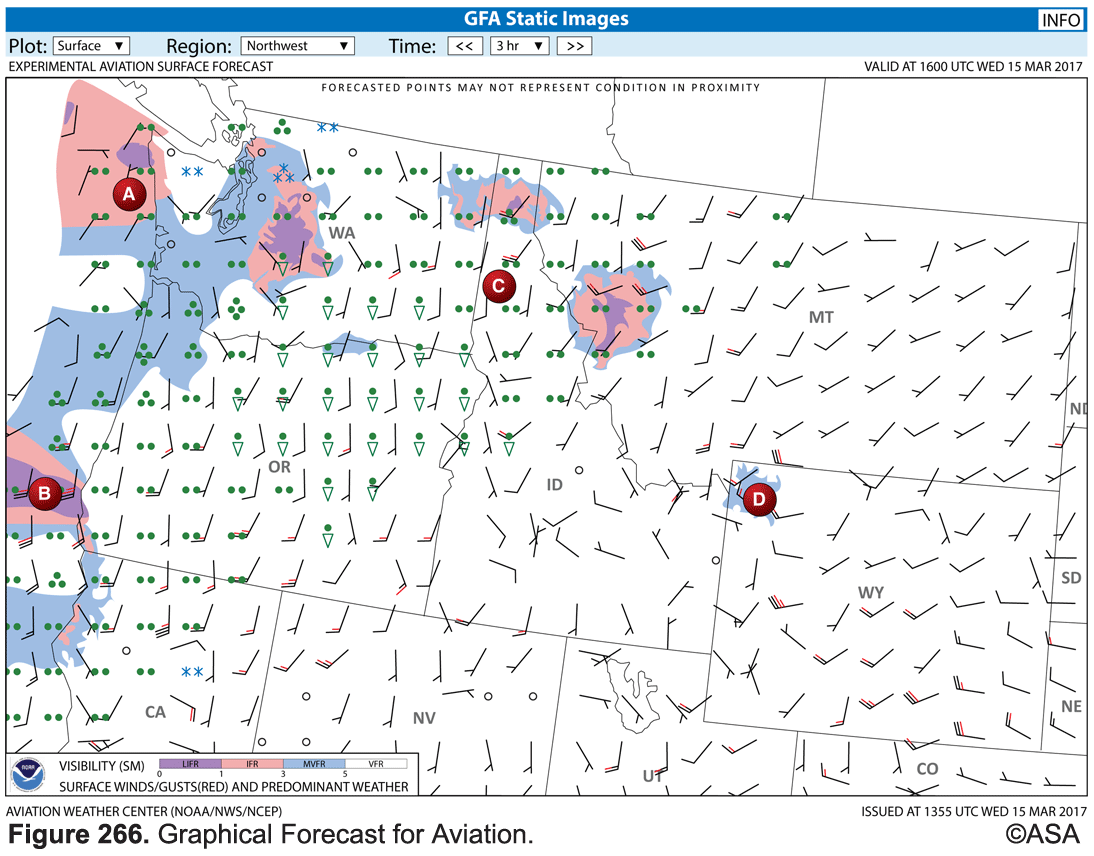
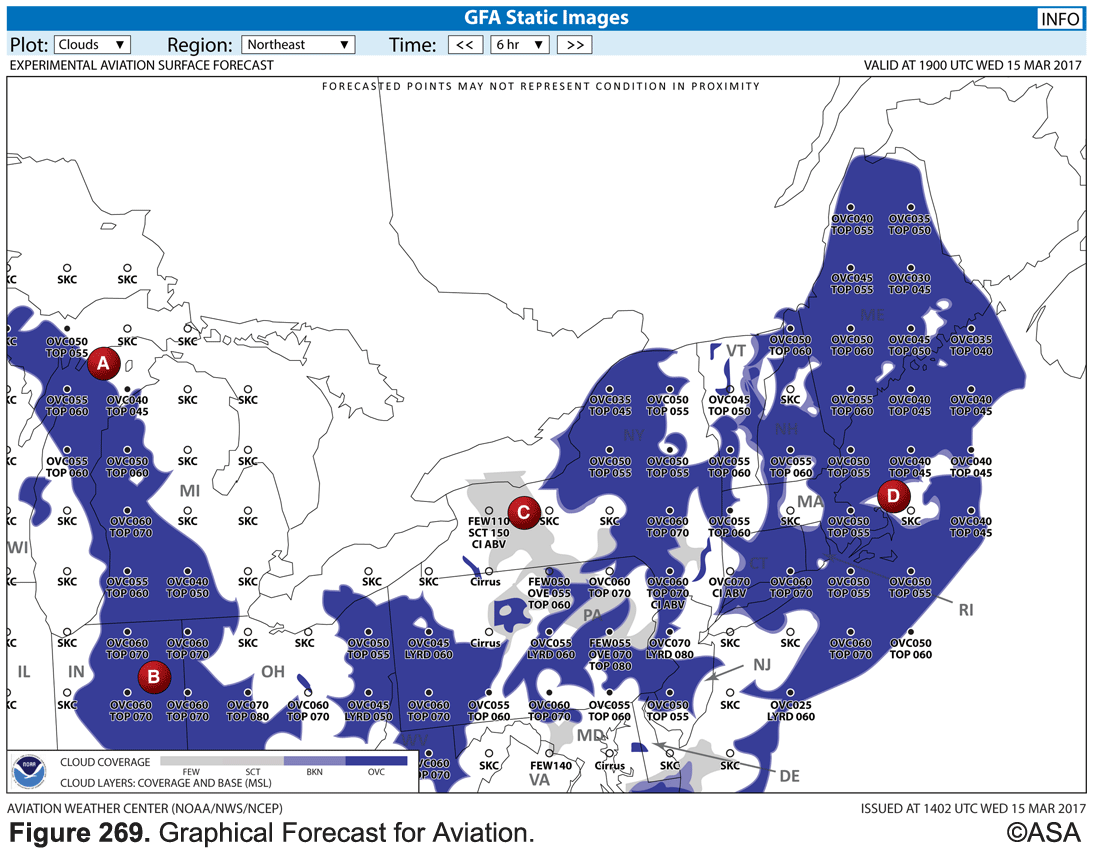
3.(Refer to Figure 269.) The cloud coverage around area B on the Aviation Cloud Forecast is forecast to be
A—Bases at 6,000 feet, tops at 7,000.
B—BRKN tops at 7,000 feet.
C—OVC at 7,000 feet.