The updated Airman Knowledge Testing Supplement for Instrument Rating (FAA-CT-8080-3F) has replaced 4 panel Low Level SIGWX Prognostic charts with updated 2 panel charts. These new figures as seen below show outlooks for both 12 and 24 hour forecast periods, with the left display being 12 hours and right 24 hours. The High Level SIGWX Prognostic chart has been updated as well with a much clearer chart. The following study information and sample test questions will help to prepare you for answering questions relating to these updated charts.
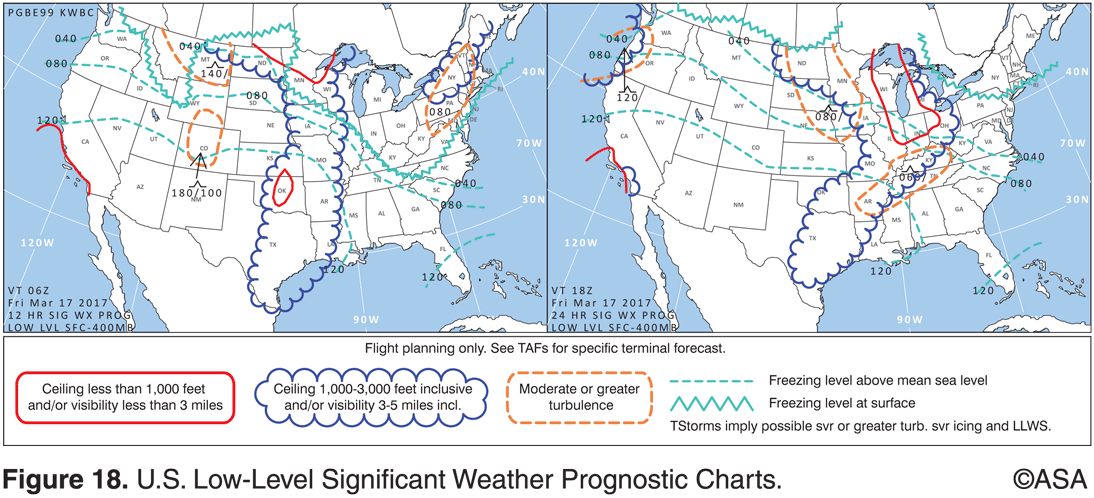
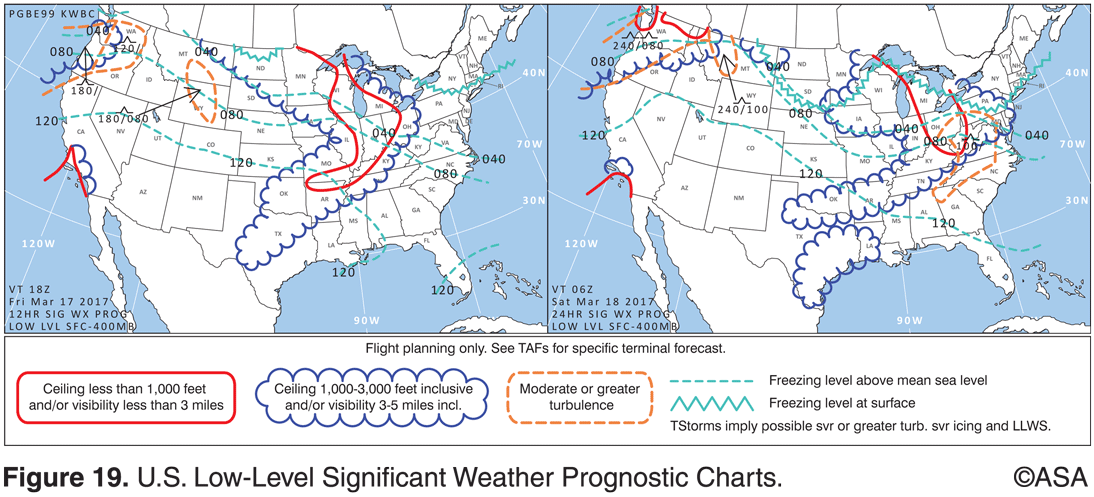
The Low-Level Significant Weather Prognostic Chart (FL240 and below) portrays forecast weather hazards that may influence flight planning, including those areas or activities of most significant turbulence and icing. It is a two-panel display representing a 12-hour forecast interval (left) and 24-hour forecast interval (right). Turbulence intensities are identified by standard symbols as shown in the figure below. The vertical extent of turbulence layers is depicted by top and base heights separated by a slant and shown in hundreds of feet MSL (180/100 = 18,000’ MSL to 10,000’ MSL). Freezing levels above the surface will correspond with a given altitude in hundreds of feet MSL (080 = 8,000’ MSL). Low-level SIGWX charts are issued four times daily, and valid time, date, and chart type are depicted in the lower left corner of each panel.
The High-Level Significant Weather Prognostic Chart (FL250 to FL630) outlines areas of forecast turbulence and cumulonimbus clouds, shows the expected height of the tropopause, and predicts jet stream location and velocity. The chart depicts clouds and turbulence as shown in the figure below.

Cumulonimbus cloud (CB) areas are enclosed by a red scalloped line. The height of the tropopause is shown in hundreds of feet MSL and enclosed in a rectangular box; centers of high (H) and low (L) heights are enclosed in polygons. Areas of turbulence are enclosed in yellow dashed lines and labeled with the appropriate severity symbol and top and base altitudes. A jet stream axis containing a wind speed of 80 knots or greater is identified by a bold green line and directional arrowhead. A standard wind symbol is placed on the jet stream to identify velocity and an associated flight level is placed adjacent to it. An omission of a base altitude (XXX) identifies that the weather phenomena exceeds the lower limit of the high-level SIGWX prog chart (FL250).
1. (Refer to Figure 18.) The right panel of the significant weather prognostic chart provides a forecast of selected aviation weather hazards up to FL240 until what time?
A—March 18th at 0600.
B—March 17th at 1800.
C—March 18th at 1800.
2. (Refer to Figure 19.) The next issuance of the 12-hour significant weather prognostic chart will become valid at
A—0000Z.
B—1200Z.
C—1800Z.
3. (Refer to Figure 20.) What is the height of the tropopause over the northwest United States?
A—45,000 feet MSL.
B—45,000 meters.
C—450,000 feet MSL.
Answers posted in the comments section.